

Small Data, Big Opportunities
by Gregory Thompson – Finance Expert @ Toptal
Data and analytics have fast become buzzwords of the day in the business world. One would be hard pressed to crack a journal without some reference to forward-thinking companies “intelligently using data” to glean insights into customer behavior, conduct risk analyses, or more efficiently manage their infrastructure. Large, data rich companies, especially those of the regulated variety, have been engaged in data-led decision making for years, best exemplified by Capital One’s pioneering of data analytics to better understand its customers—insights subsequently used to launch hyper-targeted and hugely impactful marketing campaigns that led to its runaway success.
But despite niche beginnings, the utilization of data has quickly become mainstream. There exist few credible reasons today for a given company, regardless of size and manpower, to not have analytics as a core business process/capability. Traditional objections such as cost, resources and expertise no longer cut the mustard. To the contrary, internally generated data is fast becoming a ubiquitous strategic asset leveraged the way any other would, by competitive businesses seeking to stay competitive.
This article seeks to cursorily introduce its readers to the world of data and data analytics by walking you through through the market and its dynamics, tools, and solutions before dedicating the latter half to a framework employable by small companies who seek to implement new data and analytics capabilities—a framework created by Finance and Data Analytics Expert Gregory Thompson, having spent over 30 years overseeing and implementing such initiatives across a range of firms and industries.
A Layman’s Guide to Both Big and Small Data
With the advent of the internet and with it eCommerce, social media, and the interconnectedness of devices came an explosion in the volume of globally available and analyzable data for those who possess the tools to harness it. Every tweet, post, like, left swipe, right swipe, double tap, review, text, and transaction—each is data usable to map our digital footprints that tell all about who we are, how we make decisions, where, and why. This data, appropriately termed “big data” for the vastness, depth, and complexity of its form, has unlocked a sea of possibilities in prescriptive and predictive analytics, making possible the hyper personalization of so many of the products we consume daily.
Formally, big data describes large data sets that may be analyzed computationally to reveal patterns, trends, and associations, most often as related to human behavior and interactions. For data to be termed “big,” the set/bank must be so large as to require advanced data methods and complex systems to extract value from it.
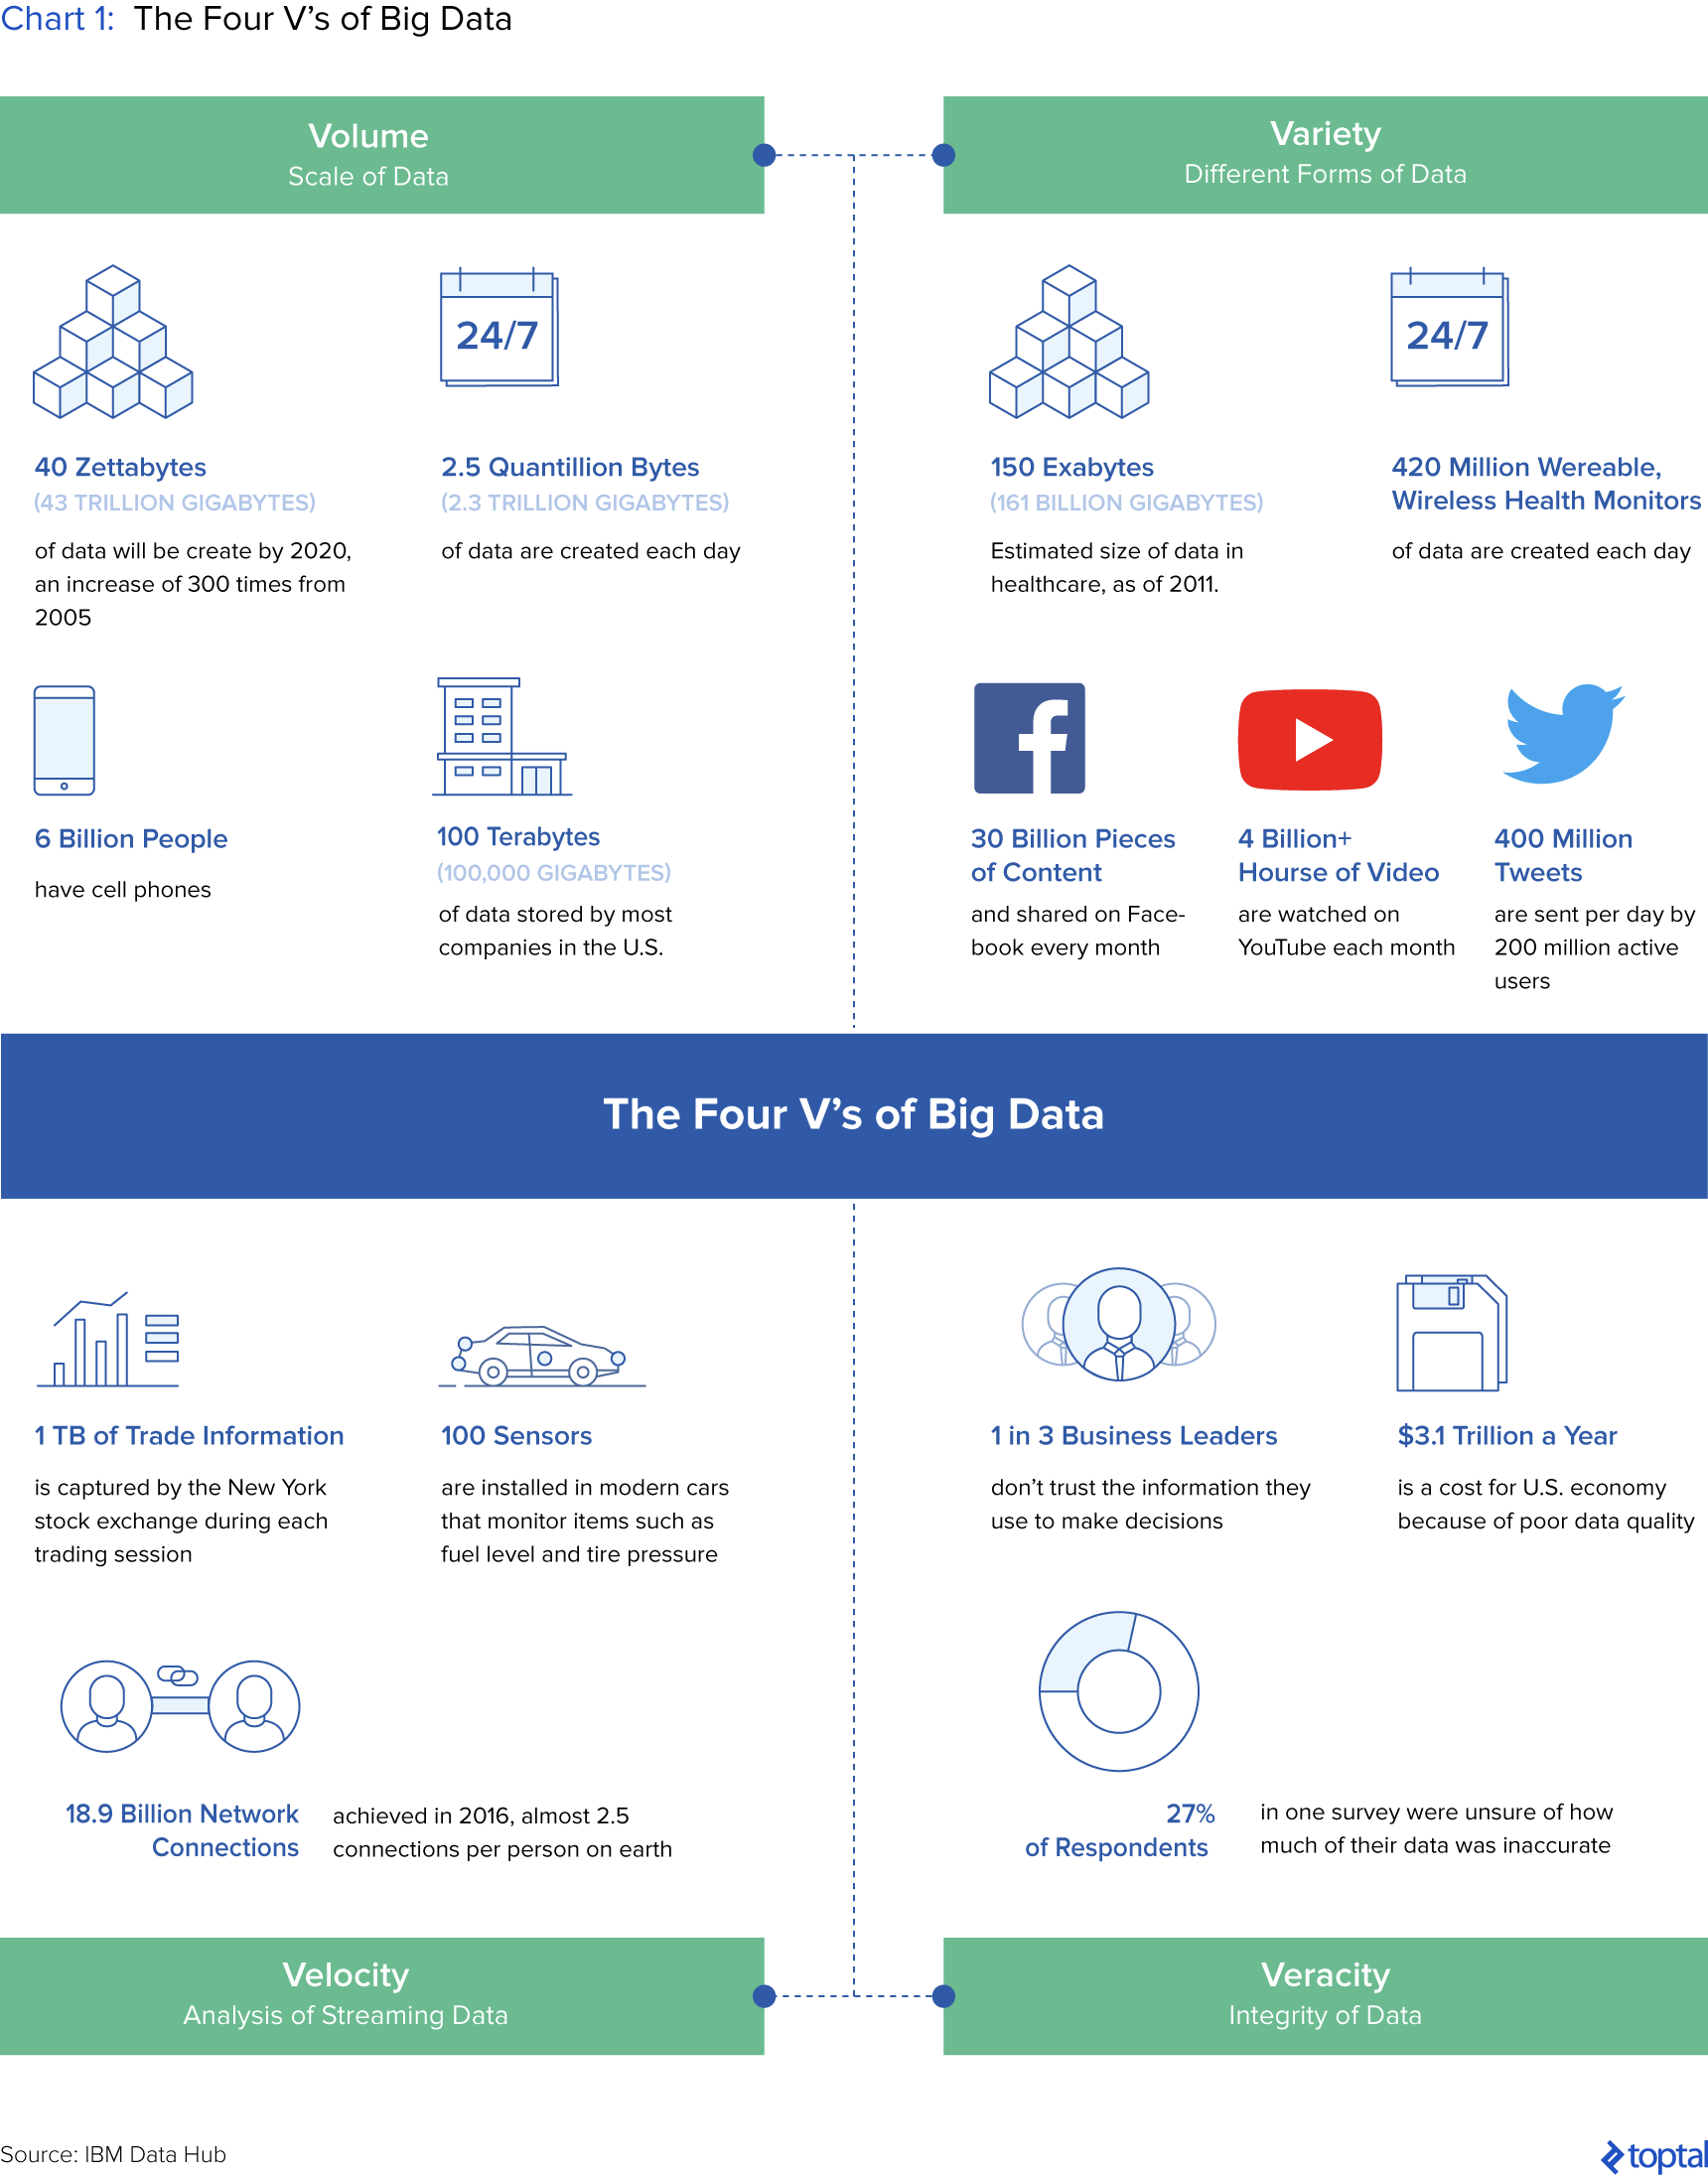
In a 2001 research report, the META Group (now Gartner) framed big data in three dimensions termed the Three Vs of data. These are as follows: Volume (quantity), Velocity (speed of generation/transmission), and Variety (range of type and source). These three V’s were subsequently expanded into Four Vs by IBM, to include Veracity (quality/integrity) of data as the final dimension required to capture value.
…but you had likely already heard of big data. Small data, on the other hand, is a subclass of data deemed modest enough so as to make it accessible, informative, and actionable by people, without the need for overly complex analytical tools. Best reduced by ex-McKinsey consultant Allen Bonde, “Big data is about machines, while small data is about people”—specifically, meaningful insights organized and packaged for the derivation of causations, patterns, and the reasons “why” about people.
SaaS-based Analytics
In tandem with the rise in both the availability and usefulness of data came the emergence of a standalone analytics industry. Once the exclusive haunt of Masters and PhD level statisticians, data scientists, and analysts, analytics has evolved into an industry of functionally robust but low-cost, self-service software-as-a-service (SaaS) platforms that enable even the most novice of users to extract value from their data. Smaller companies that previously lacked the expertise or budgets required to execute this sort of analysis are now competing on closer to equal footing with their better resourced counterparts and establishing defensible motes in their markets.
In addition to the cost benefits of the SaaS model, research by the Aberdeen Group, a technology and services research company, illustrates that organizations that adopt SaaS tools have twice as many employees who instinctively use data to make decisions and achieve their ROI targets 40% faster than those that do not. For most companies, email marketing reports, Google Analytics, and other third-party web-based analytics tools are already in active use, in addition to internally generated reports from accounting, marketing, ERP, and CRM systems and used as the primary mechanism for monetizing their small data.
More to this, and though it is a large and growing market whose precise measurement can be difficult, IDC estimates the worldwide business intelligence and analytics tool market at almost $14 billion as of 2017, growing at a rate of 11.7% y-o-y, with Forrester Research, a global market research company, forecasting a CAGR of 15% through 2021.
Market Share Data
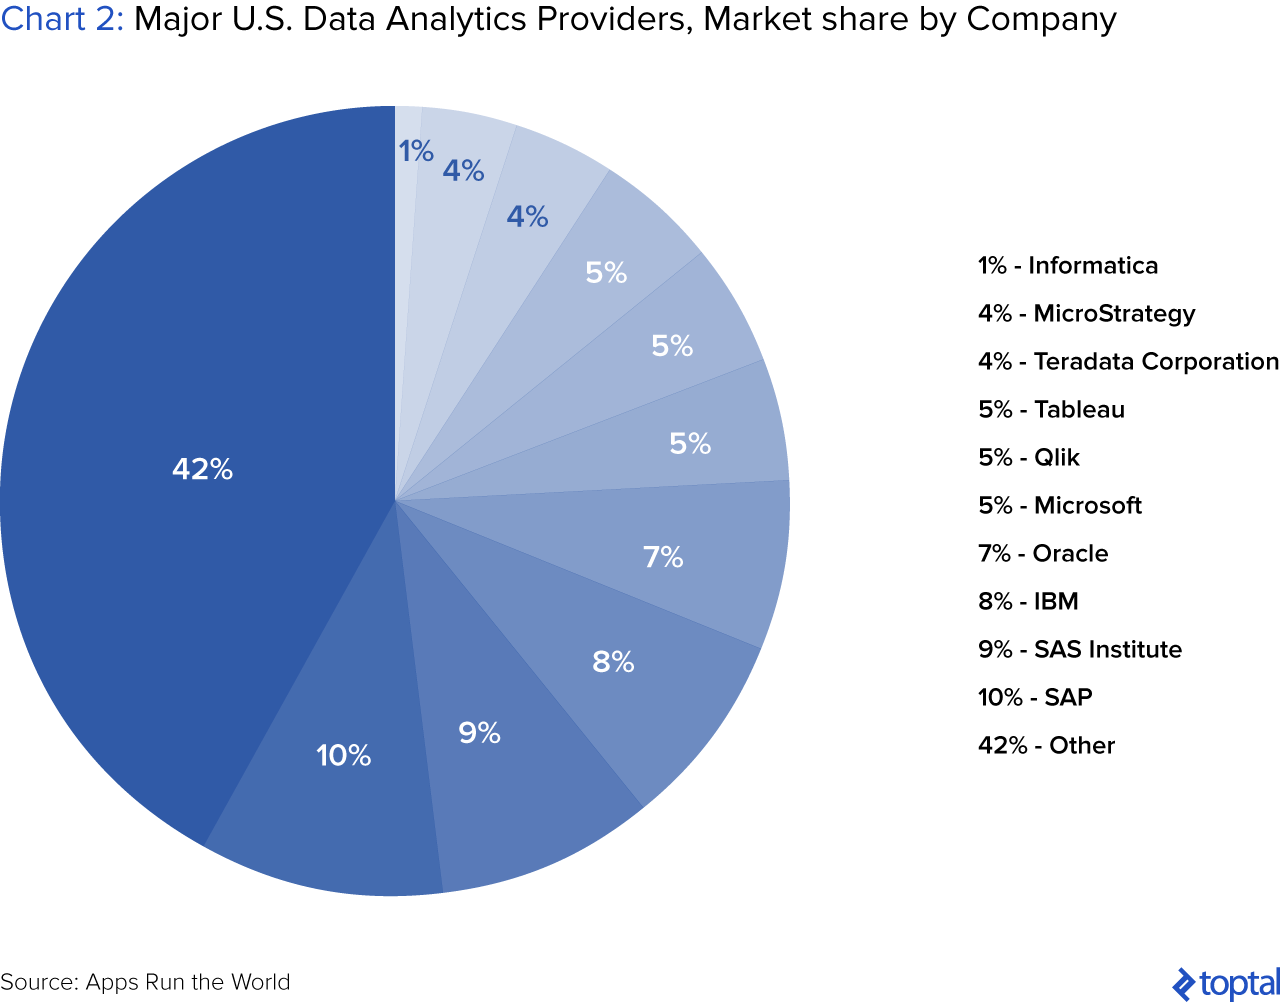
Unsurprisingly, the market for analytics tools and solutions is dominated by the old guard of software companies—companies such as SAP, IBM, Oracle, and Microsoft. As of 2015, SAP led the market with 10%market share and $1.2 billion in analytics and business intelligence (BI) product revenues; SAS Institute was number two, with a 9% share; IBM, third with 8%, and Oracle and Microsoft in fourth and fifth place, respectively, with 7% and 5%. Interestingly, the market share of the five largest vendors has been declining due to the above-market growth of venture capital-backed startups such as Sentiment Strategies, Tableau, and Teradata, suggesting that much of the industry’s future growth will be generated by smaller, faster, more agile companies.
A Data Analytics Implementation Guide for Small Companies
At the highest possible level, a data-centric culture affords management greater confidence that it is able to make the best possible decisions, often and consistently, while working from the same version of the truth—a transparent, quantifiable one. After all, most of us have sat through sessions where warring executives have put forward/defended different arguments by leaning on different anecdotal sources, fact patterns, and interpretations, quickly bringing into question the integrity of the inputs and therefore the outputs. Thus, the first decision that must be made by a given small business seeking to walk the data analytics road is whether said business truly seeks to become a data-driven organization.
Once this top-down decision has been made, a framework must be established to optimize the potential and usefulness of the new strategic priority. To begin, several questions must be asked. The first, what are the short and long-term objectives of the given firm, project, initiative, or department? Second, who should be responsible for the effort and its outcomes? Third, what specific problems are the firm, project, initiative, or department seeking to solve with data? And fourth, what tools should be used to drive the initiative?
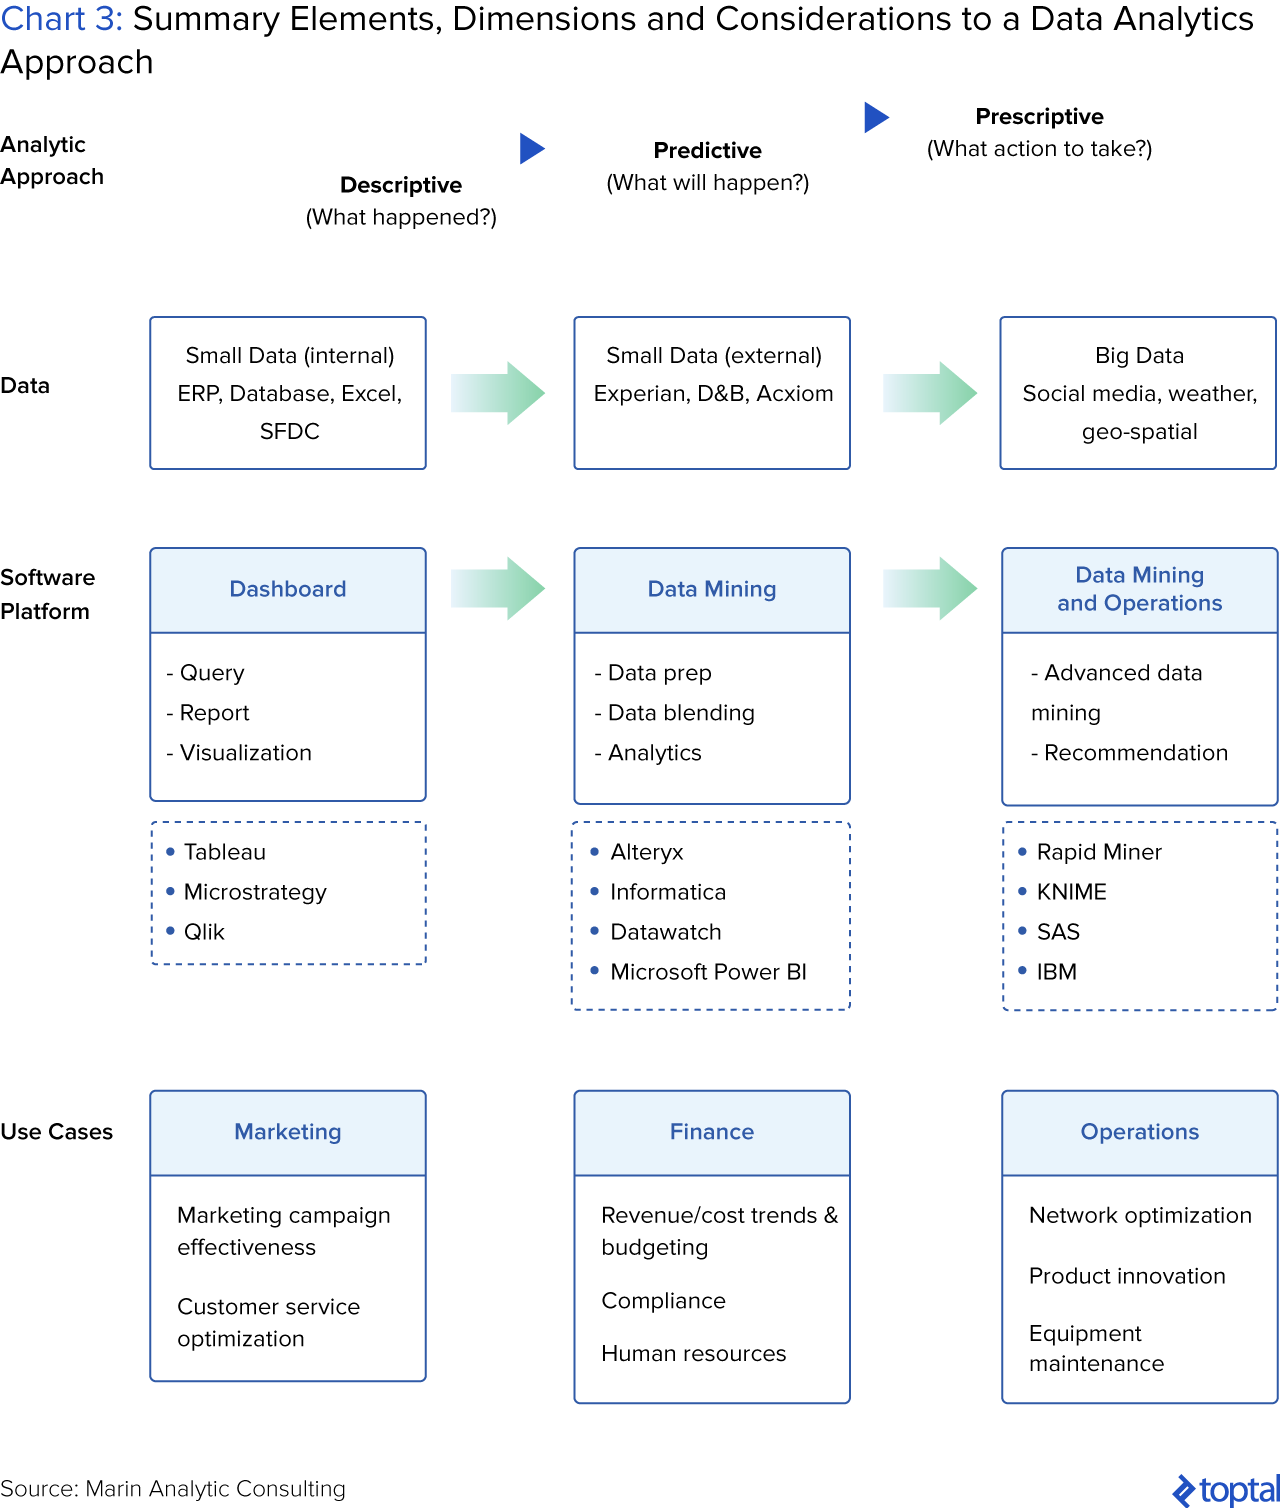
Once these questions have been answered, the next step is to formulate a tangible execution plan which, with a bit of planning, organizational structure, top-down direction, and bottom-up enthusiasm, will position the organization at hand to generate real and measurable results more consistently than it has done in its past. The diagram below is designed to provide a framework to consider the various elements of a simple data analytics approach.
To the Question of Objectives
This is the first important question to get right. At a high level, the superordinate goal for any company seeking to leverage its data is to develop a systematic process for making sound business decisions—a process that is consistent and repeatable, and that yields measurably better results. At this juncture, it is important to note that becoming a sound data-oriented organization is a journey and not a destination, and as such, “buy-in” from the top and consensus from the bottom are important foundational steps that will prove critical to mass adoption and fully utilized analytical assets. Having achieved buy-in, a tried and tested next step is to strategically arrange a few “quick wins” to drum up the threshold excitement and engagement needed to see this process through to fruition. Consensus building, buy-in, and quick wins achieved, both research and my experiences dictate an implementation approach that assumes the following structure, sequence, and considerations:
Begin with descriptive analytics—a simple visual dashboard that highlights corporate performance using existing transactional data to draw conclusions that had previously proved inconclusive without quantifiable data. Next, develop drill-down capabilities within your dashboard, sharing insights, performance takeaway(s), and self-help instructions strategically and with the right colleagues/organizational influencers. This will kickstart both the dissemination process to their subordinates and the data-reliance culture you seek to cultivate.
Stage two: Graduate to more sophisticated predictive analytics capabilities, either using in-house technical resources or with the help of third-party providers. These predictive capabilities blend both internal and external data sources to better answer specific business questions such as, “What is the likelihood that a customer will defect?,” or, “Customers who purchase x, typically also purchase y,” and provide real-time insight into departmental or a given initiative’s performance. “Outside data sources” in this case includes social media data, sales force data, or user experience data, all of which provide rich and statistically significant sources of insight, where in-house data is still too limited to be leverageable on its own.
The third stage is to move on to advanced, prescriptive analytics that helps determine the appropriate action to guide/preempt consumer, corporate, competitor, employee, or supplier behavior against the backdrop of historical data. It should be noted though that this stage usually begins to mark the transition from small data to big; and yet, it is a necessary step that should be incorporated into your company-wide decisions-process to ensure the highest levels of input-output integrity and consistency in decision making.
In-depth View of the Different Stages of Analytics
Descriptive Analytics – Dashboards
It is a truism that what is measured is managed, and so by developing a single data-deterministic truth, leaders within an organization are better able to make sounder, more unified decisions. Dashboards are the starting point of such analytics journeys, and the visual illustration of a company’s data-deterministic truth. Of course, what is relevant to one group may be meaningless to another, so due consideration should be given to the purpose or theme of a given dashboard, what information should be included, who the relevant receptor audience is for its content, and what the question/problem is that said group is seeking to answer/solve.
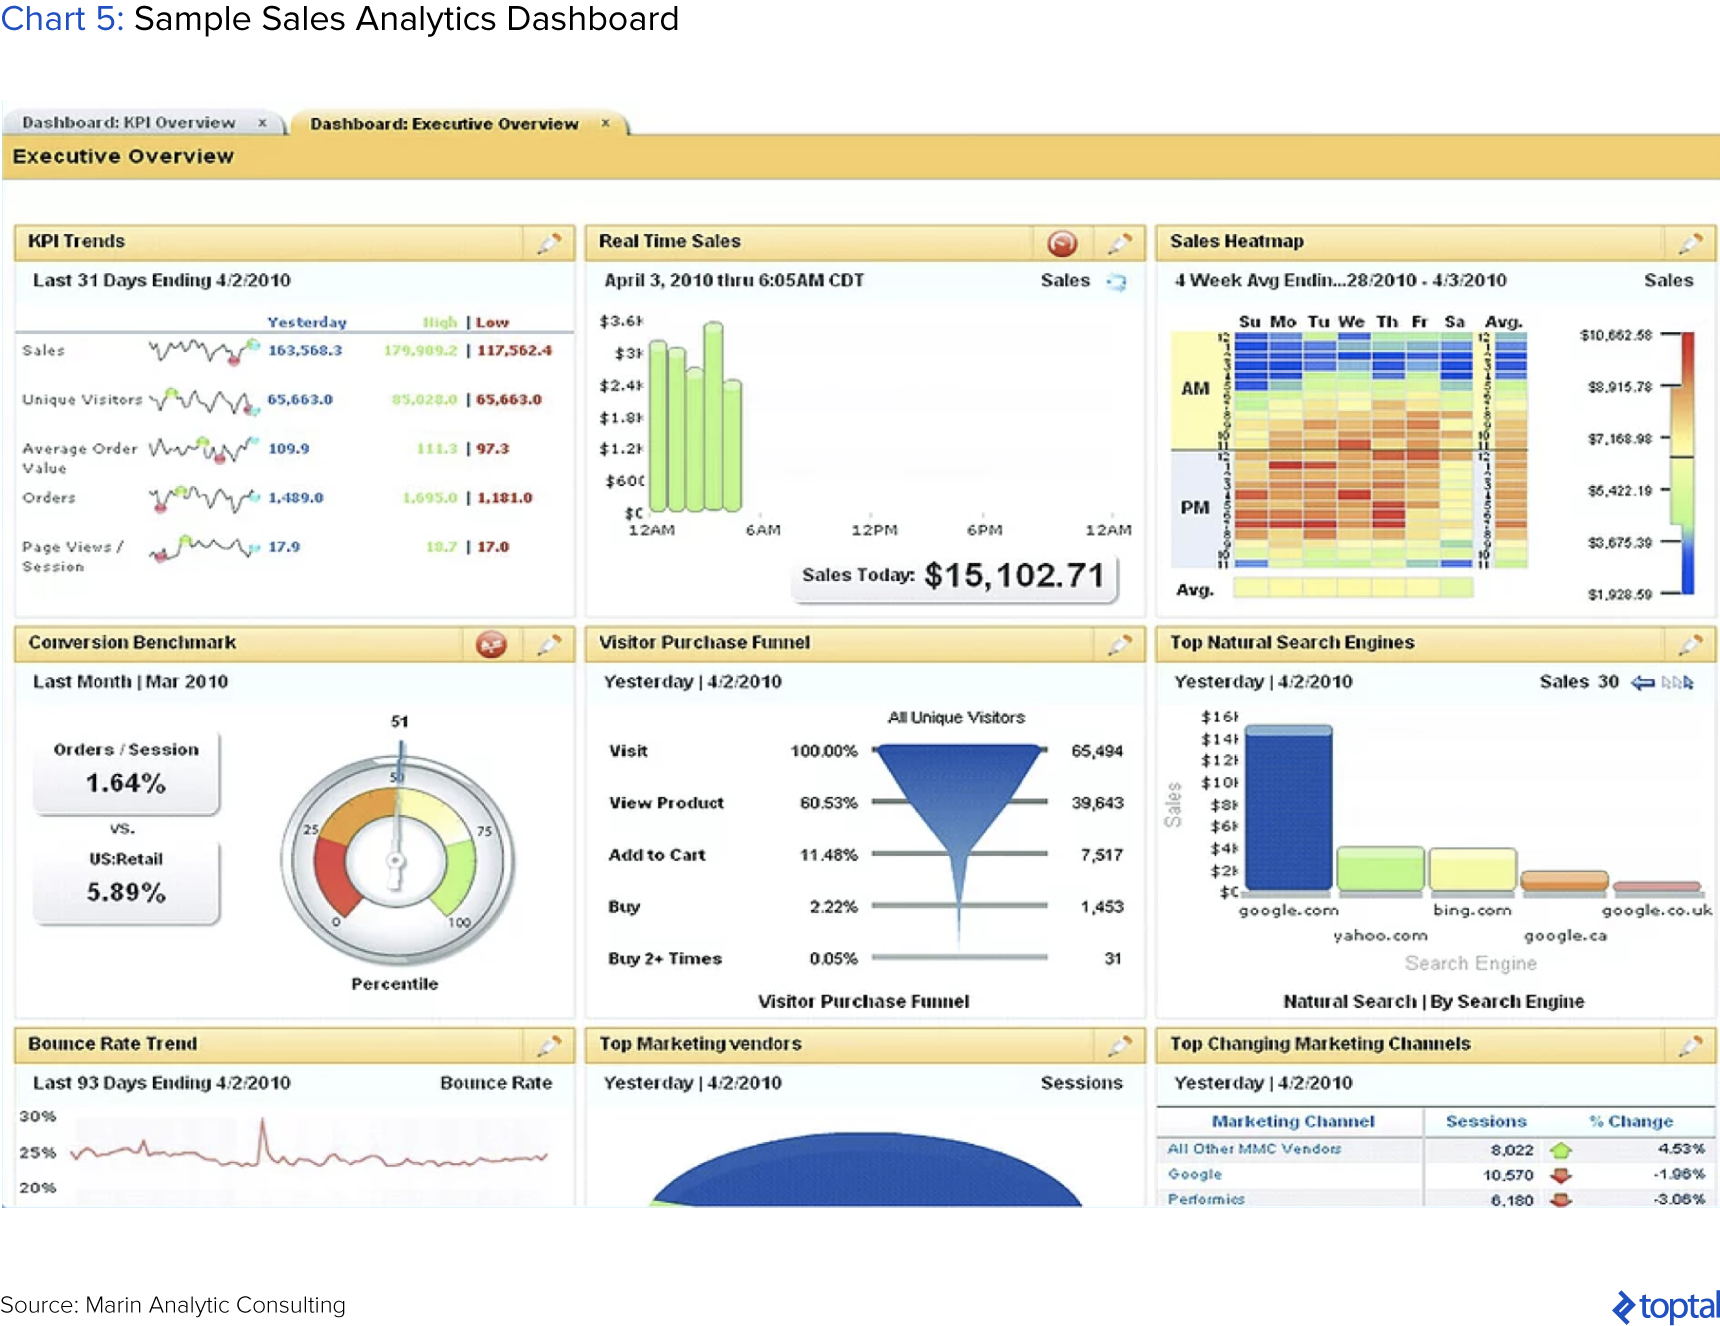
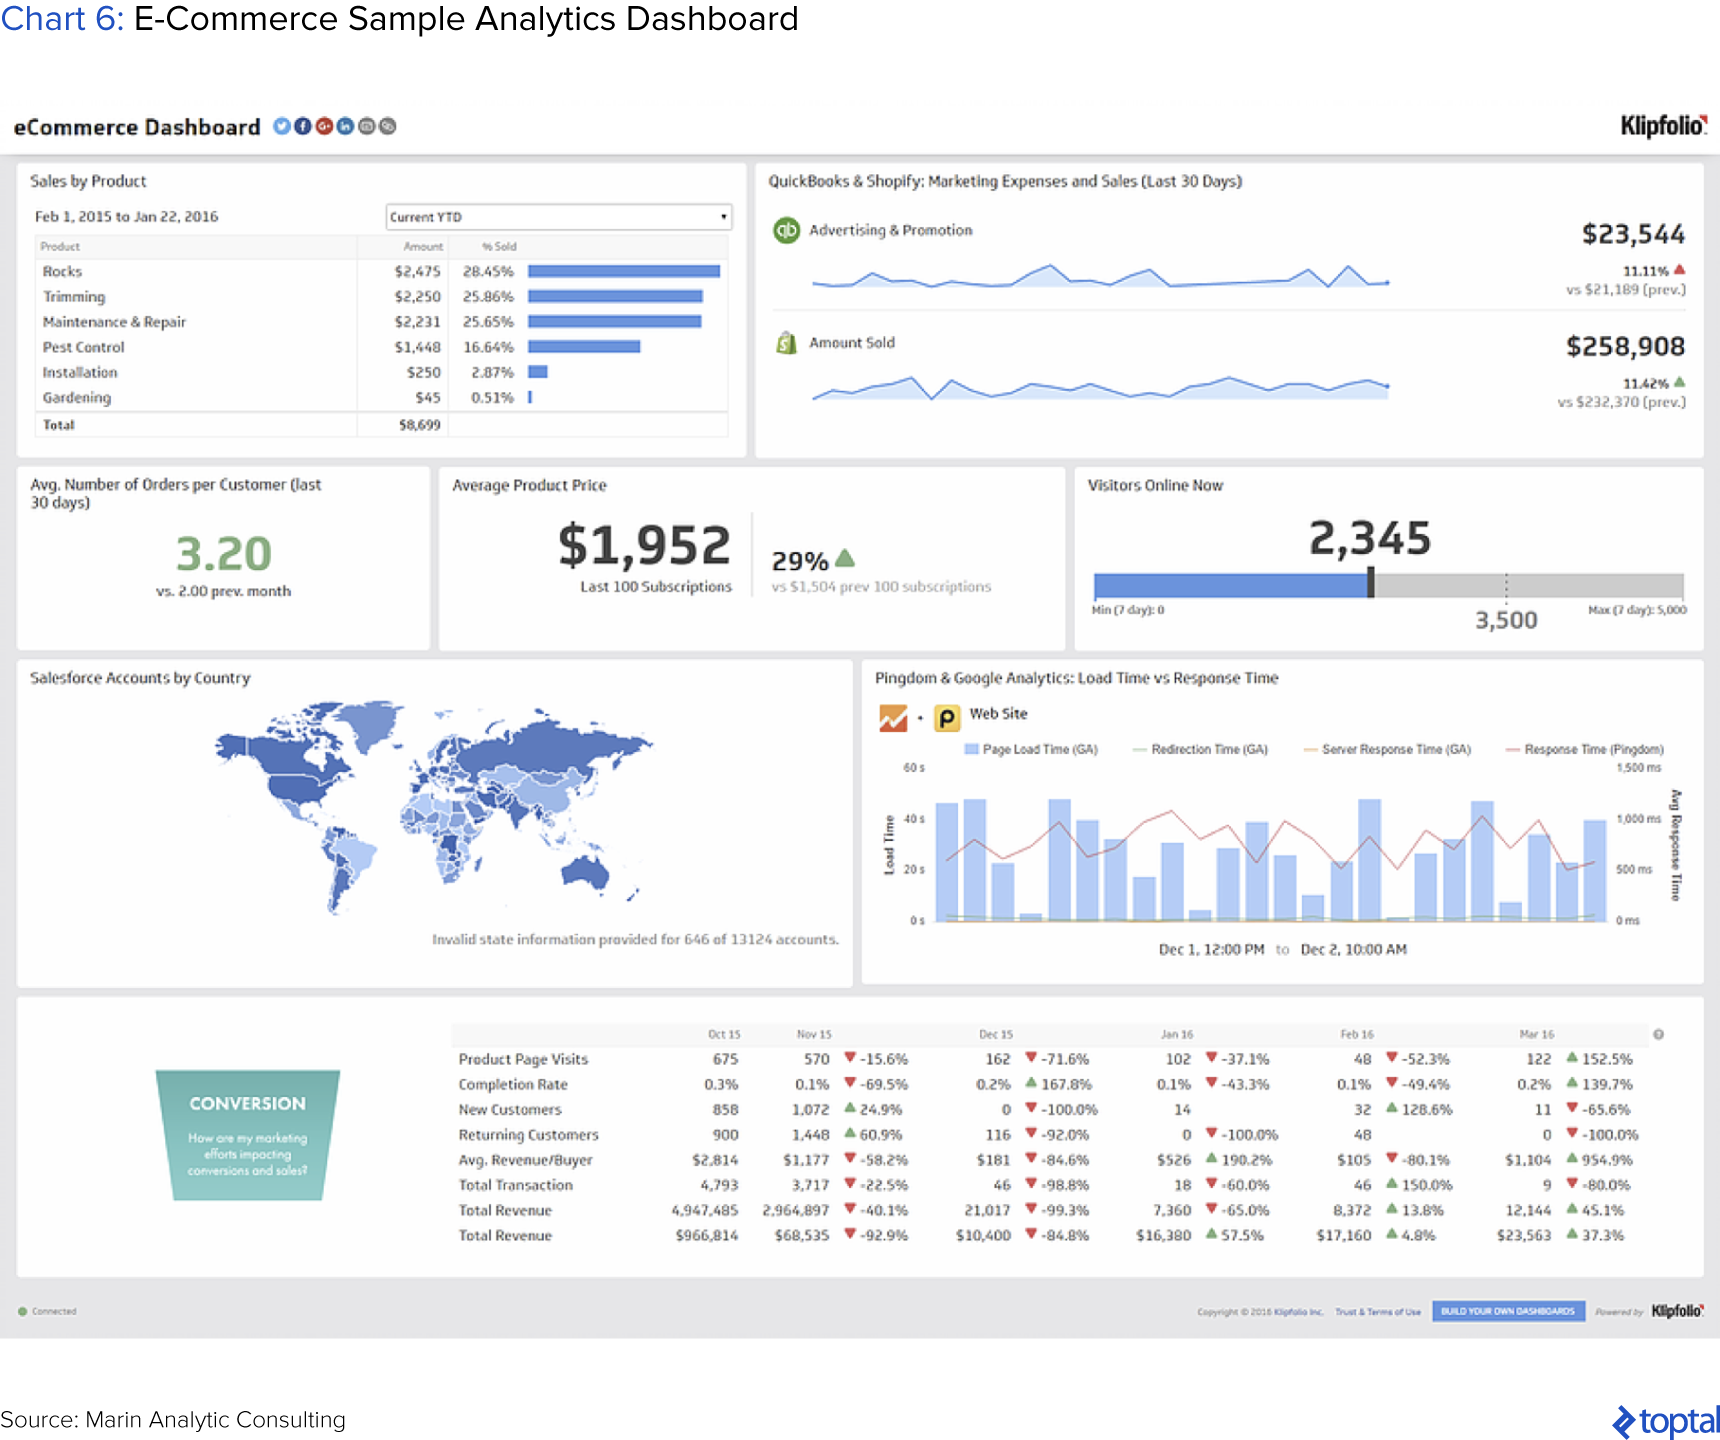
Well-designed dashboards drive decision-making rather than simply present historic information, and the best effectively focus the attention on trends and recurring patterns (both positive and negative) while accurately illustrating the vitals of a business. More sophisticated dashboards provide drill-down capabilities that enable leaders to get to the root causes of a diagnosed problem with annotation and sharing capabilities that allow for more dynamic, real-time viewing.
Predictive Analytics – Data Blending, Exploration, and Querying
Once the dashboard process is completed, the aspiring data-driven organization may begin to get more ambitious. To this, a typical next step is to “use voluminous and varied data to perform more advanced analysis and provide further dimension to the decision domain.” By blending company-specific data further enriched with those of third parties, ranging from vertical specific vendors such as Experian, Acxiom, and D&B to social media or sales data providers such as Facebook, Twitter, and Salesforce, the given firm may explore larger, wider, more varied, and statistically significant sets for new and better insights into the company’s performance and customer behavior.
Prescriptive Analytics – Deployment of Analytics into Business Processes
Enterprise level companies with different needs in terms of data, customers, regulations, and specific business problems/issues and with different budgets and internal skillsets will likely have technology vendors who address their more unique needs. They operate at a scale where the ability to operationalize the analytics into their business processes and workflows becomes more important and economic. Often, these companies will be in regulated industries where they need to be able to demonstrate that they have fair and repeatable treatments in place.
Lenders show no bias in their lending policies, whether for sex, income, or race.
To the Question of Responsibility
It is one thing to determine a specific action and another to implement it. There needs to be a connection between diagnosis, prescription, and decision and an individual/group responsible for the desired outcome. It is here that the role of the executive sponsor becomes important.
At both small and large companies, said executive sponsor—the nominated champion of the data enrichment and de facto chief data officer—is an individual, usually the CEO, CFO, or CMO at onset, already steeped in data and analytics, attuned to the sort of problems best solved by data, or at least a believer in the transformative potential of data analytics.
In addition to this protagonist, the process also typically requires a secondary, more hands-on champion, especially once the firm begins to transition from descriptive to predictive analytics. Traditionally, this person was a technically trained, in-house data scientist, but has more recently been taking the form of a tech-savvy enthusiast often referred to as the citizen data scientist. This individual typically self-selects—a self-professed spreadsheet jockey with the right balance of intellectual curiosity and dexterity, but one willing to live in the implementation weeds. In many cases, this individual is ahead of management in recognizing the impact potential a formal data analysis process can create at their firm, but simply lacked the status or credibility required to sell their vision.
To the Question of the Business Problem
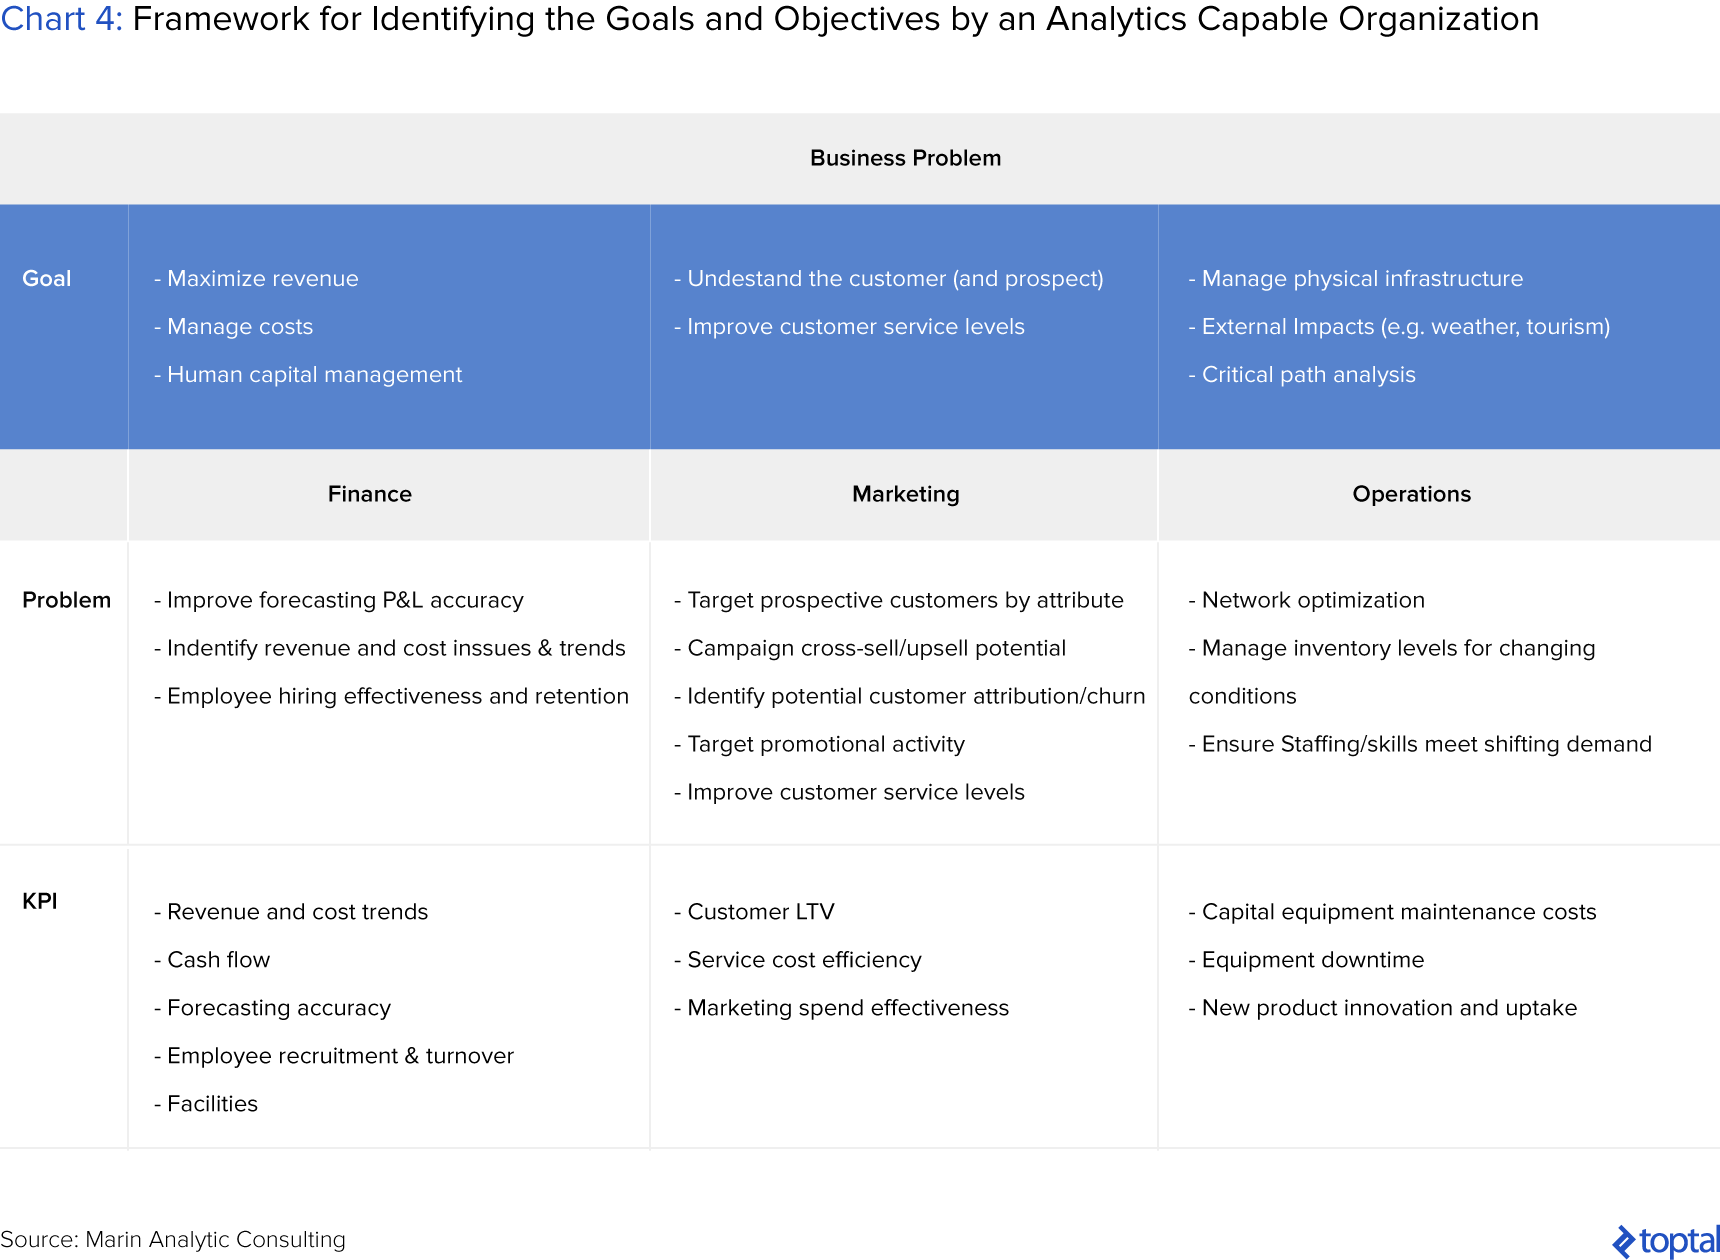
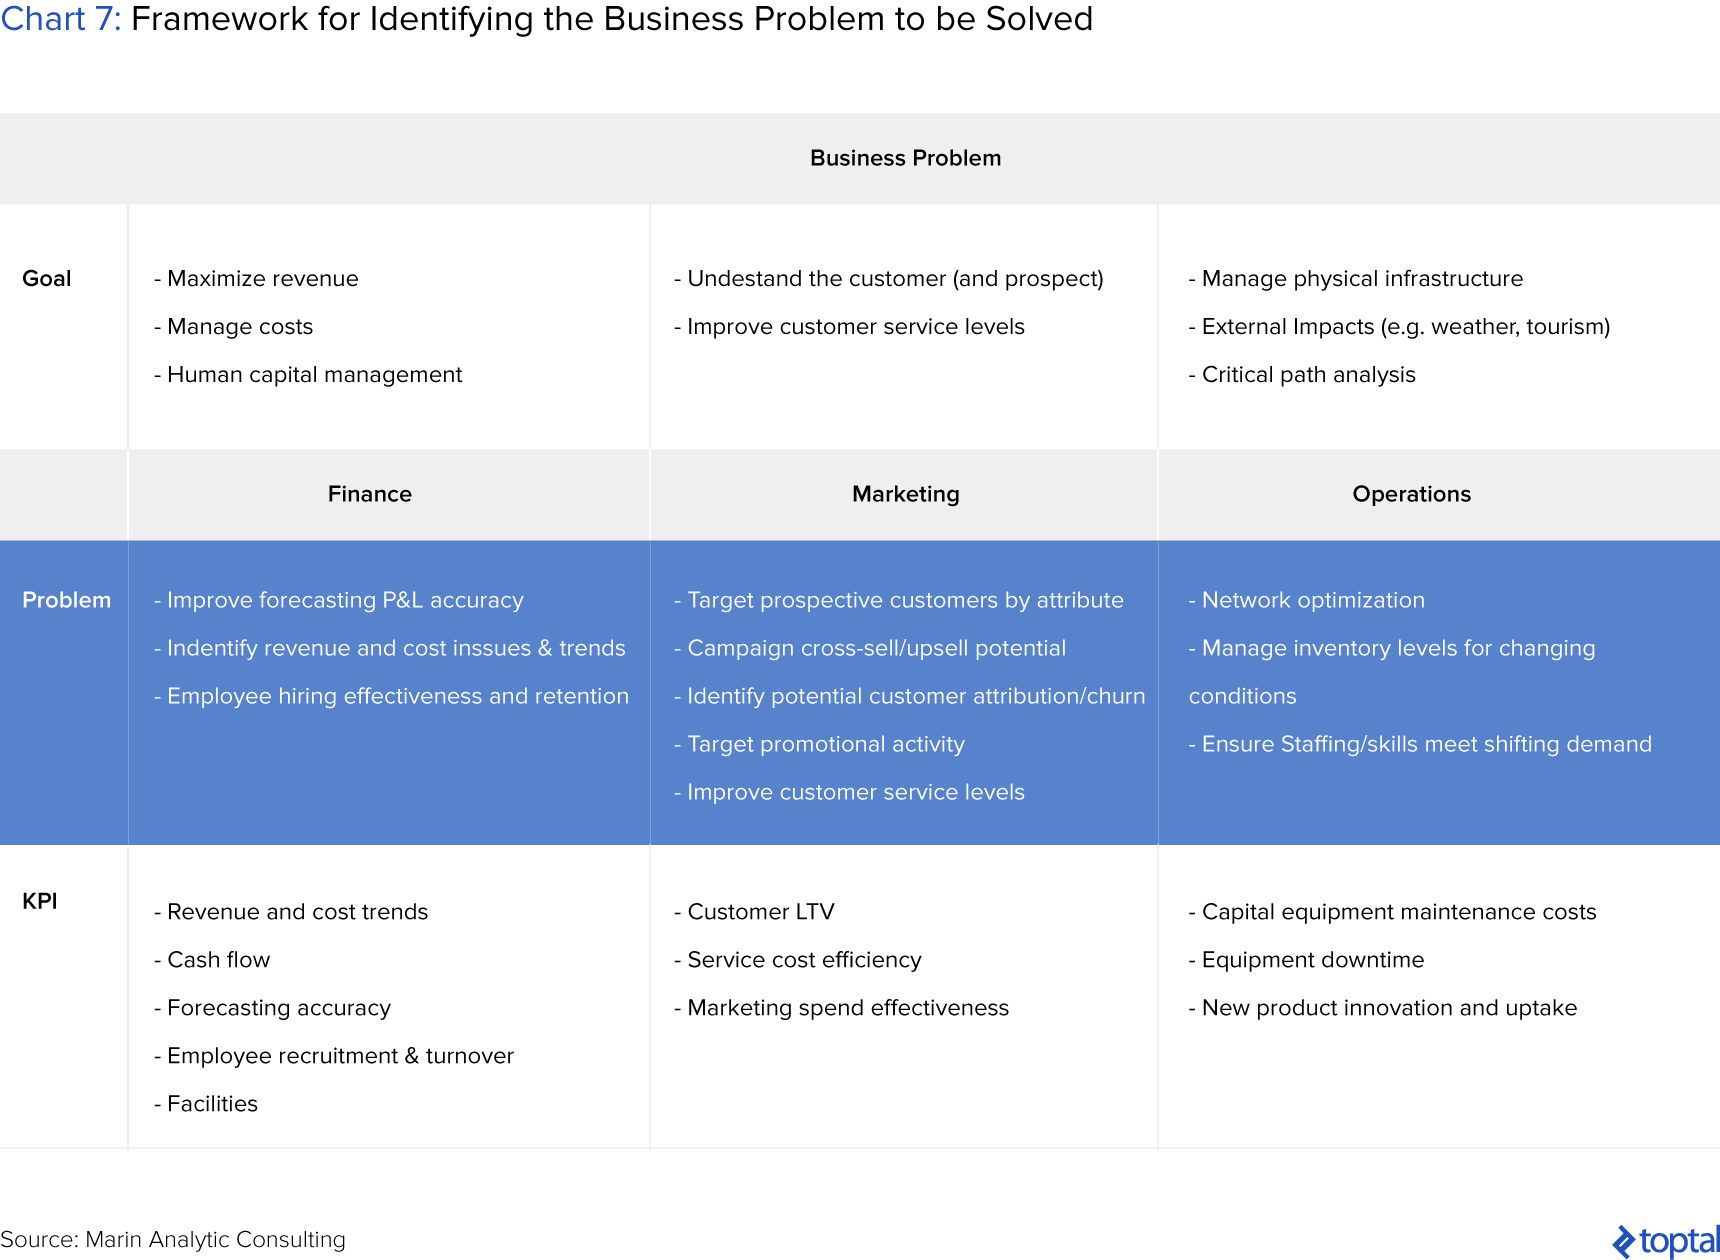
Every successful and failing company has its unique set of challenges only addressable by the appropriate combination of resources, processes, and capabilities specific to it. That said, the sorts of business challenges best suited to being addressed by data can, more often than not, be reduced, categorized, and addressed using the framework set out in Chart 7.
In addition, a few anecdotal guidelines/parameters have been devised over the years, which further optimize the chances of not just identifying the right sorts of problems to tackle with data, but also their chances of being successfully resolved. These guidelines/parameters are as follows: First, choose simple, clear questions whose implications matter greatly; second, in seeking answers from data, aim for the practicality of the solution rather than the perfection of an academic answer; third, keep the nature and knowledge base of your recipient audience in mind in delivering the diagnosis and solution; and finally, only select problems that are measurable and quantifiable with already existing data and solutions that can, in equal measure, be tracked.
To the Question of the Right Tools and Methods
The final of our original four framework questions, where building a sustainable data-oriented organization is concerned, is one regarding the selection of tools, methods, or platforms. To this, I’ll first state that data analysis tools have evolved considerably in recent years, with various pros and cons to the business user. The pros include a substantial drop in the costs associated with leasing such tools and a rise in the feature list and complexity of available options as they have transitioned from function-specific tools to platforms of overlapping functionality. Further, SaaS vendors offer free trials, albeit with restrictions on the volume and data-type; new patrons are afforded the opportunity to make an informed purchasing decision after testing multiple platforms.
The major con to these platforms is that, in a bid to stay competitive with one another, vendors have innovated so aggressively toward complexity that their offerings now approach feature-saturation with offerings that are beyond the average business users’ usefulness. The unfortunate result is the overwhelming of the novice user, making it harder to achieve the “quick wins” discussed earlier and thus reducing the likelihood that the data culture will take hold in a given firm.
Fortunately, there are many resources available to assist prospective users, evaluate, and compare competing business intelligence solutions, though some knowledge of core common capabilities is useful in evaluating them against a company’s specific needs and priorities. A few such capabilities include: number and scope of data connections, availability of pre-assembled dashboards, drill-down, publishing and sharing capabilities, integration with data blending and exploration software capability, scaling potential (on both volume and variety parameters), number and accuracy of modeling approaches, and the customer reference bases per specific industry. Though admittedly simple in its summary, Chart 7 above sets out some key vendors that play across various categories (descriptive, predictive, prescriptive).
Small Data, Big Opportunities
Despite its niche beginnings, it is clear that data analytics and the market for SaaS-based analytics tools has evolved considerably in recent years, much to the benefit of the citizen data scientist and their company. Big data, small data, self-service tools—each are sufficiently mainstream now to warrant their consideration as a core competency of even the least technical of businesses. Said differently, with so much useful, actionable data being generated and the costs of self-service tools moving inversely to the features and capabilities on offer, few reasons will continue to exist for even small businesses to not begin to leverage data in some capacity.
This article should have illustrated that, with a little planning, objective setting, and patron selection, even your startup can begin to level the competitive playing field with the industry titans you have set out to disrupt, in the process unlocking tremendous economic value for you and your stakeholders. You need only get started; so go ahead—get started!
UNDERSTANDING THE BASICS
What is a small business?
An independently owned and operated company, corporation, partnership, or sole proprietorship that is limited in size, as determined by revenue, profits, headcount, and other measures, depending on the industry.
What is big data?
A subjective measure that describes data sets so large that they cannot be managed and analyzed by typical data processing tools. Thus, they must be analyzed computationally, most often to reveal patterns, trends, and associations, especially relating to human behavior and interactions.
What is data analytics?
The process of examining varied data sets in order to draw conclusions about the information they contain, including hidden patterns, unknown correlations, market trends, customer preferences, and other things that can help organizations make more informed business decisions.
What are the techniques for data mining?
Data mining is the analytical process by which data is explored to reveal consistent patterns and/or systematic relationships between variables, subsequently validated by applying said patterns to new subsets of data. There are several major techniques used in data mining, including association, classification, cl
(This article was originally posted on toptal.com and reposted with the permission of Toptal and the author.)